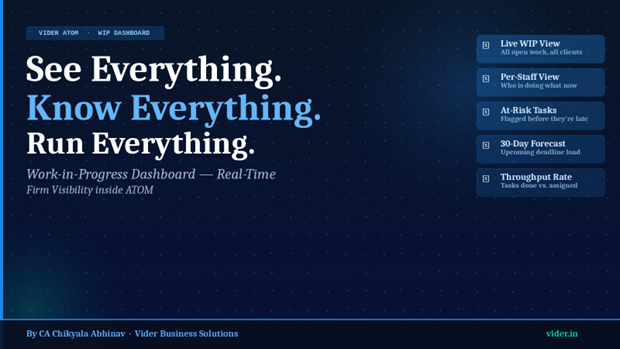
See Everything. Know Everything. Run Everything: The WIP Dashboard in ATOM — Real-Time Firm Visibility
How ATOM's Work-in-Progress dashboard gives CA firm partners total operational awareness in one screen
How ATOM's Work-in-Progress dashboard gives CA firm partners total operational awareness in one screen
CONTENTS
Home Chronicles ATOM


Imagine trying to fly an aeroplane without instruments. You might be able to see that you are in the air. You might feel that the plane is roughly level. But you would have no idea of your actual altitude, your speed, your fuel level, your heading, or whether any of the critical systems are approaching failure. You would be operating entirely on intuition and hope — and at some point, intuition and hope are not enough.
Running a CA firm without a real-time dashboard is surprisingly similar. You know roughly how busy the firm is. You have a sense of which clients are well-served and which might be at risk. But you do not know, in real time, how many tasks are overdue across the firm. You do not know which team member is overloaded and which has spare capacity. You do not know how many notices are sitting unanswered. You are flying on intuition.
ATOM's Work-in-Progress (WIP) dashboard changes this. It is the instrument panel of the CA firm — giving partners complete, real-time operational awareness in a single screen.
1. Total Open Work by Status
The dashboard's primary view shows all open tasks across the firm, categorised by status: not started, in progress, under review, and awaiting client. This single number — 'here is everything that is currently open in the firm' — is something most partners have never seen before implementing ATOM. It is often a revelation.
2. Urgency Distribution
Beneath the total, the WIP dashboard breaks down open tasks by urgency: how many are in the Green zone (on track), Yellow zone (approaching deadline), and Red zone (critical — due within 3 days or overdue). The Red number is the one that demands immediate attention.
3. Per-Team-Member Load
The staff view within the WIP dashboard shows every team member's current task count, broken down by urgency. This makes capacity imbalances immediately visible — allowing partners to redistribute work before it becomes a crisis rather than after.
4. Per-Client Status
Partners can also view the WIP dashboard through the client lens: for each client, what is currently open, what is approaching a deadline, and what is at risk. This view is particularly valuable for partner-led client relationship reviews and for preparing for client meetings.
5. 30-Day Deadline Forecast
The forecast view shows all deadlines falling in the next 30 days, by week. This gives the firm a forward-looking view of workload concentration — alerting partners to weeks where the deadline load is unusually high and allowing proactive resource planning.
“The WIP Dashboard is the answer to the question every CA partner asks every morning: 'What does the firm actually look like right now?' ATOM answers it without anyone needing to be asked.”
| Dashboard View | What It Shows | When to Use It |
| Firm-wide total | All open tasks by status and urgency | Every morning on login |
| Staff load view | Tasks per team member by urgency | Workload distribution decisions |
| Client view | Open work by client | Client meeting preparation |
| 30-day forecast | Upcoming deadlines by week | Capacity and resourcing planning |
| Overdue only | Tasks past their deadline | Daily escalation review |
Firms that implement the WIP dashboard consistently report the same set of early outcomes: the first thing they discover is overdue tasks they did not know existed. The second thing they discover is workload imbalances that had been invisible. The third thing they discover is clients whose work has been stalled at an intermediate stage — 'under review' for far too long because the reviewer had not seen it in their queue.
Each of these discoveries, on its own, justifies the investment in ATOM. Together, they represent the fundamental shift from managing a CA firm reactively to managing it proactively.
Can the WIP dashboard be filtered to show only specific partners' portfolios?
Yes. The WIP dashboard supports filters by partner, team member, client, service type, and deadline window. Each partner can configure their personal dashboard view to show exactly the information most relevant to their role.
Is the WIP dashboard data updated in real time?
Yes. All data in the WIP dashboard reflects the current state of the system — as tasks are updated, completed, or created by team members, the dashboard updates immediately. There is no manual refresh required.
Related Posts
Best Practice Management Tool for Chartered Accountants in India by CA Chikyala Abhinav Why ATOM Is the Best Practice Management Tool for Chartered Accountants in India by Nikhil Katkam P F A & Associates - Segment: Income Tax Advisory & Compliance How ATOM & ATOM Pro Revolutionized My CA Practice: A Journey by CA. Naveen Kumar Best Company Secretary Software in India - Vider ATOM